Sooner or later you will discover that state diagrams can become very messy. In many cases just drawing a state diagram includes certain assumptions that are not true in general. Perhaps certain cases of inputs will never happen, hence the corresponding arcs are simply not drawn. Certain cases of outputs are not significant and sometimes are left out. An algorithmic state machine (ASM) diagram offers several advantages over state diagrams:
In this document, a _n suffix is added to indicate negative logic signals.
An ASM chart has an entry point and is constructed with blocks. A block is constucted with the following type of symbols.
|
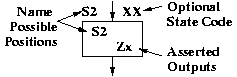
| One state box. The state box has a name and lists outputs that are asserted when the system is in that state. These outputs are called synchronous or Moore type outputs. |
|
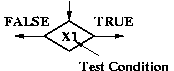
| Optional decision box(es). A decision box may be conditioned on a signal or a test of some kind. |
|
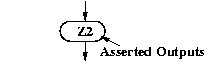
| Optional conditional output box(es). Such an ouput box indicates outputs that are conditionally asserted. These outputs are called asynchrous or Mealy outputs. |
There is no rule saying that outputs are exclusively inside an a conditional output box or in a state box. An output written inside a state box is simply independent of the input, while in that state.
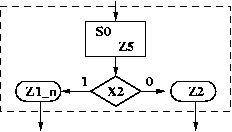
The idea is that flow passes from ASM block to ASM block, the decisision boxes decide the next state and conditional output. Consider the following example of an ASM diagram block. When state S0 is entered, output Z5 is always asserted. Z1_n however is asserted only if X2 is also high. Otherwise Z2 is asserted.
The drawing of ASM charts must follow certain necessary rules:
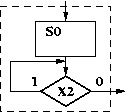
| 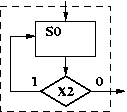
|
| Incorrect | Correct |
 Parallel Form |
 Serial Form |
|
The use of ASM charts is a trade-off. While the mechanics of ASM charts do reduce clutter in significant designs, its better to use an ordinary state diagrams for simple state machines. Here is an example Moore type state machine with input X and output Z. Once the flag sequence is received, the output is asserted for one clock cycle. The corresponding ASM chart is to the right. Note that unlike the state diagram which illustrates the output value for each arc, the ASM chart indicates when the output Z only when it is asserted. 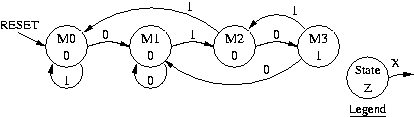 State diagram for sequence detector |
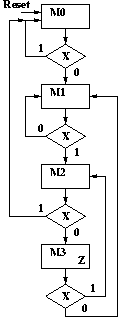 ASM chart |
The following timing diagram illustrates the detection of the desired sequence. Here it is assumed that the state is updated with a rising clock edge. The key concept to observe is that regardless of the input, the output can only be asserted for one entire clock cycle.

Simply stated, timing diagrams are prone to a particular problem for the reader, in that there can be too much to see. Timing diagrams clearly expresses time relationships and delay. However, in synchonous sequential logic, all registers are updated at the rising edge of the system clock. The clock period is just set to an arbitrarily value. Provided that the input setup-and-hold requirements are satisfied, the details of the timing diagram are distracting.
The goal of an event table is that given a scenario, to neatly summarize the resultant behavior of synchronous sequential logic. In writing an event table, capitol T refers to the system clock period and nT means n times the system clock period. For asynchronous input changes, the time is given, assuming that the system output reacts instantaneously. For synchronous signals, the + symbol means a moment suitably after the given time, for the system to become settled. The - symbol however, means a moment suitably before the given time, satisfying the necessary setup time.
To reduce the clutter, be sure to fill in those signals that change state or are updated. The following event table summarizes the behavior in the above timing diagram. An empty entry will be interpreted to mean no-change to the corresponding signal during the corresponding clock cycle.
| Time | Reset | X | State | Z |
| 0T | 1 | 0 | M0 | 0 |
| 0.4T | 0 | |||
| 1T+ | M1 | |||
| 1.3T | 1 | |||
| 2T+ | M2 | |||
| 2.6T | 0 | |||
| 3T+ | M3 | 1 | ||
| 3.6T | 1 | |||
| 4T+ | M2 | 0 | ||
| 4.4T | 0 |
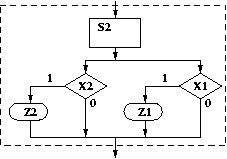
The following is an example of an ASM chart with inputs X1 and X2, and outputs Z1 and Z2. In state S0 the outputs are immediately dependent on the input. In state S1, output Z1 is always asserted. In state S2, output Z1 is dependent on input X1 but Z2 is not asserted.
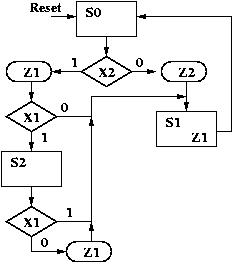
The following is the corresponding state diagram. The legend indicates how the input and output are associated with each arc. The 'd' symbol, which refers here to the don't-care condition helps to reduce the clutter. While the state diagram and ASM chart here are similar in complexity, state diagrams quickly become messy.

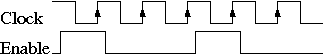
Simply stated, a clock enable indicates when a state machine must pay attention to the system clock. The figure below has a clock signal and a clock enable, note that this clock enable is asserted for one clock period at a time. The clock enable concept is powerful as it allows a device to effectively be clocked at a rate slower than the system clock, while remaining entirely synchronous with the rest of the system. In this case the effective clock rate is one-third that of the system clock.
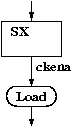
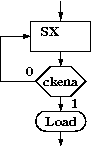
In the spirit of reducing clutter, a clock enable can be written next to a state box. When not asserted, the device remains in its current state. The following figues are equivalent. Further, it is assumed that devices controlled by such a state, as directly or indirectly enabled by the clock enable as well.
I use the term "generalized state machine" (GSM) to describe a departure from classic examples of what a state machine is. In designing such a machine it helps to keep track of:
To illustrate, consider a system that counts the number of times that a button is pressed. (** more to come **)
Please Let me know that you read my web pages.
Notes to me:
To get a better feel for how output is dependent on input, consider
timing diagram.
Simplfy decision trees.
Written by: Krista Hill
Date: Mon Jul 29 19:25:13 EDT 2019